Benchmark Results
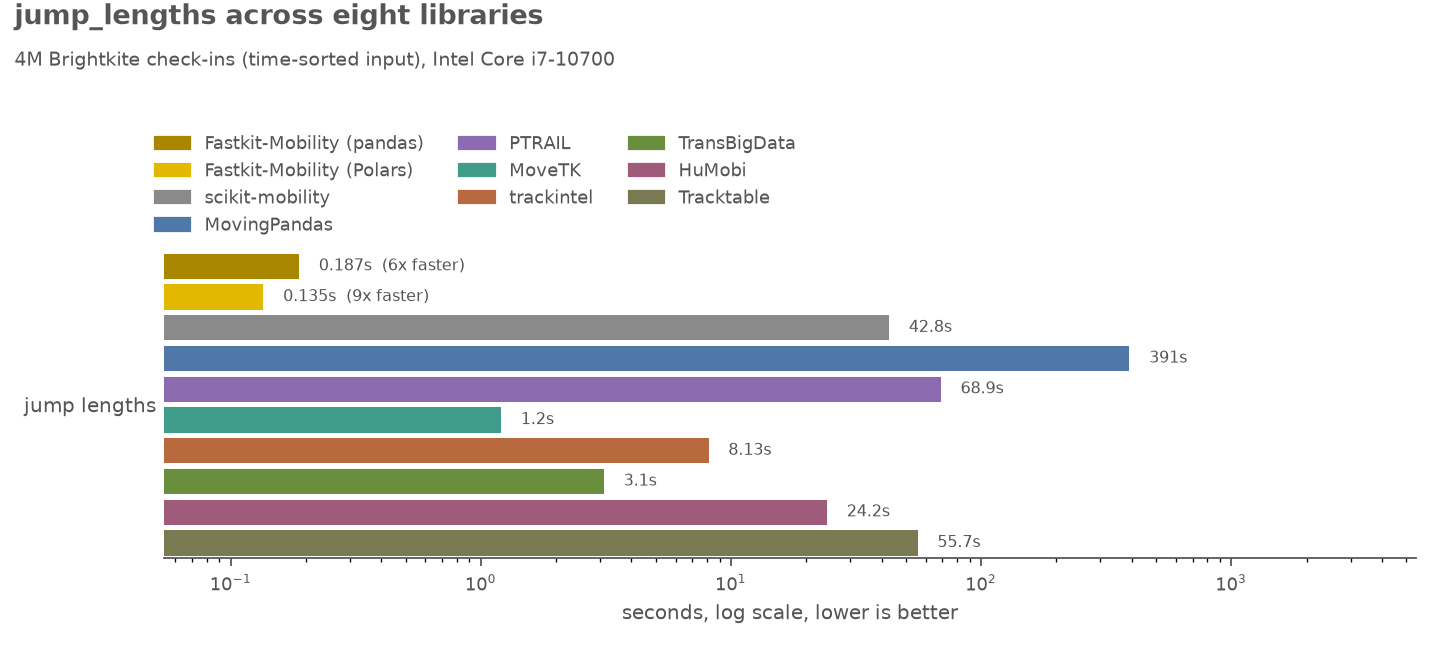
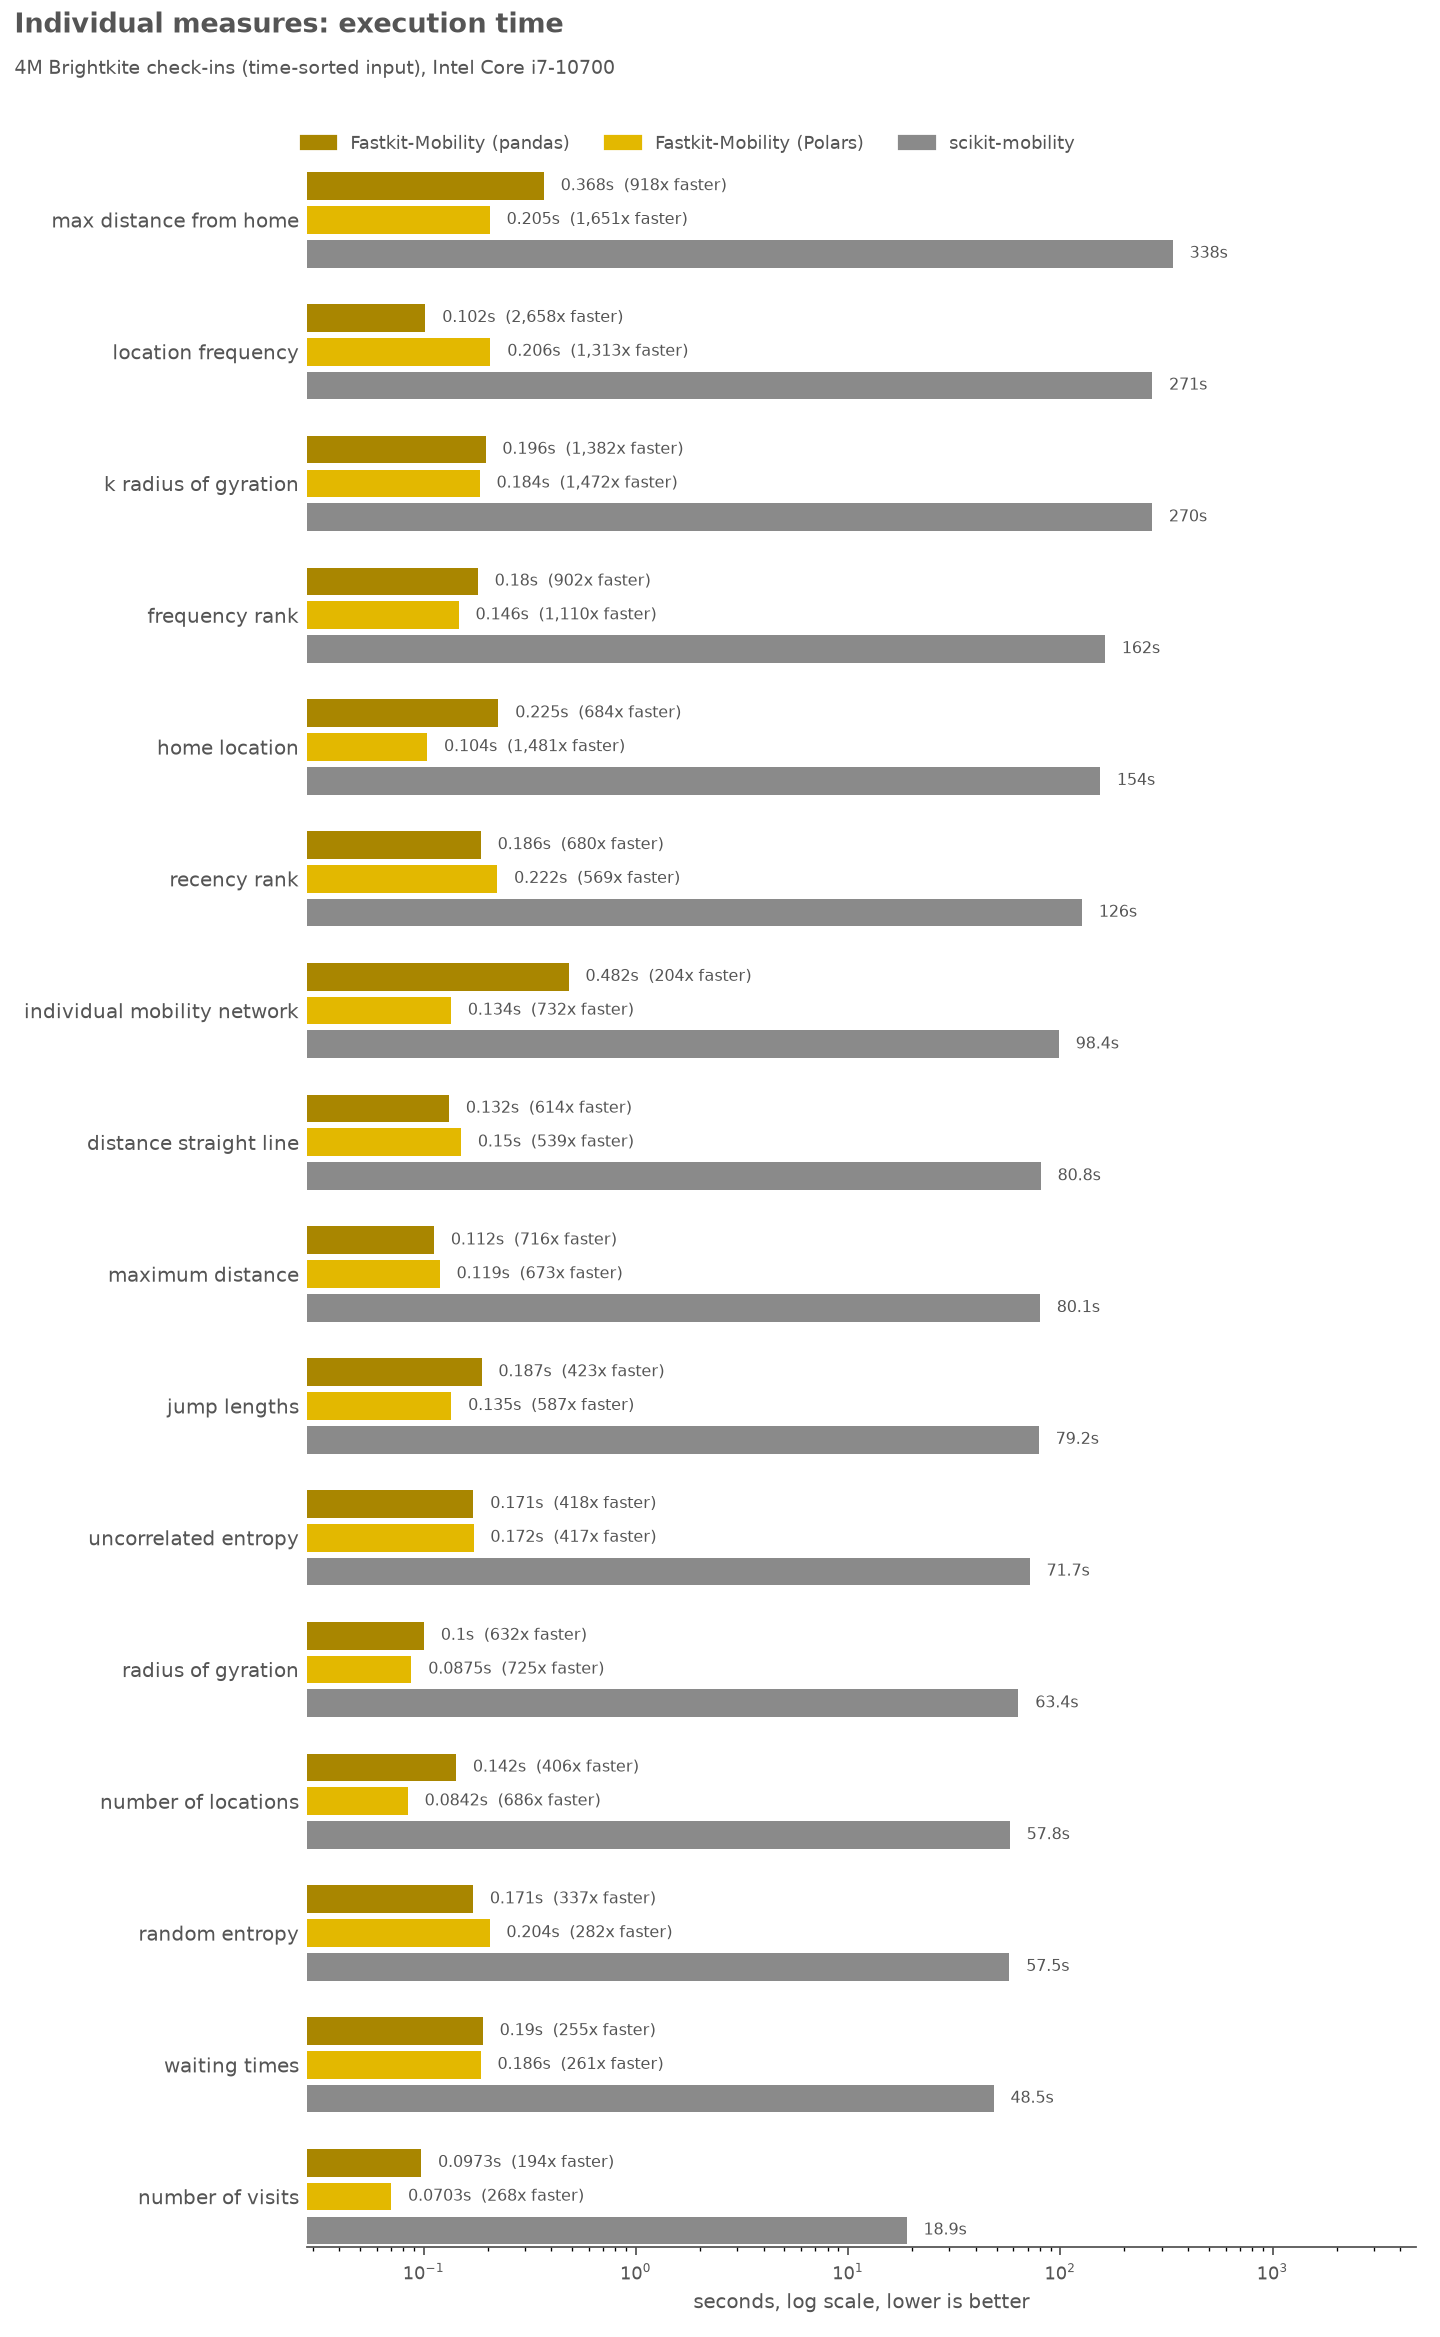
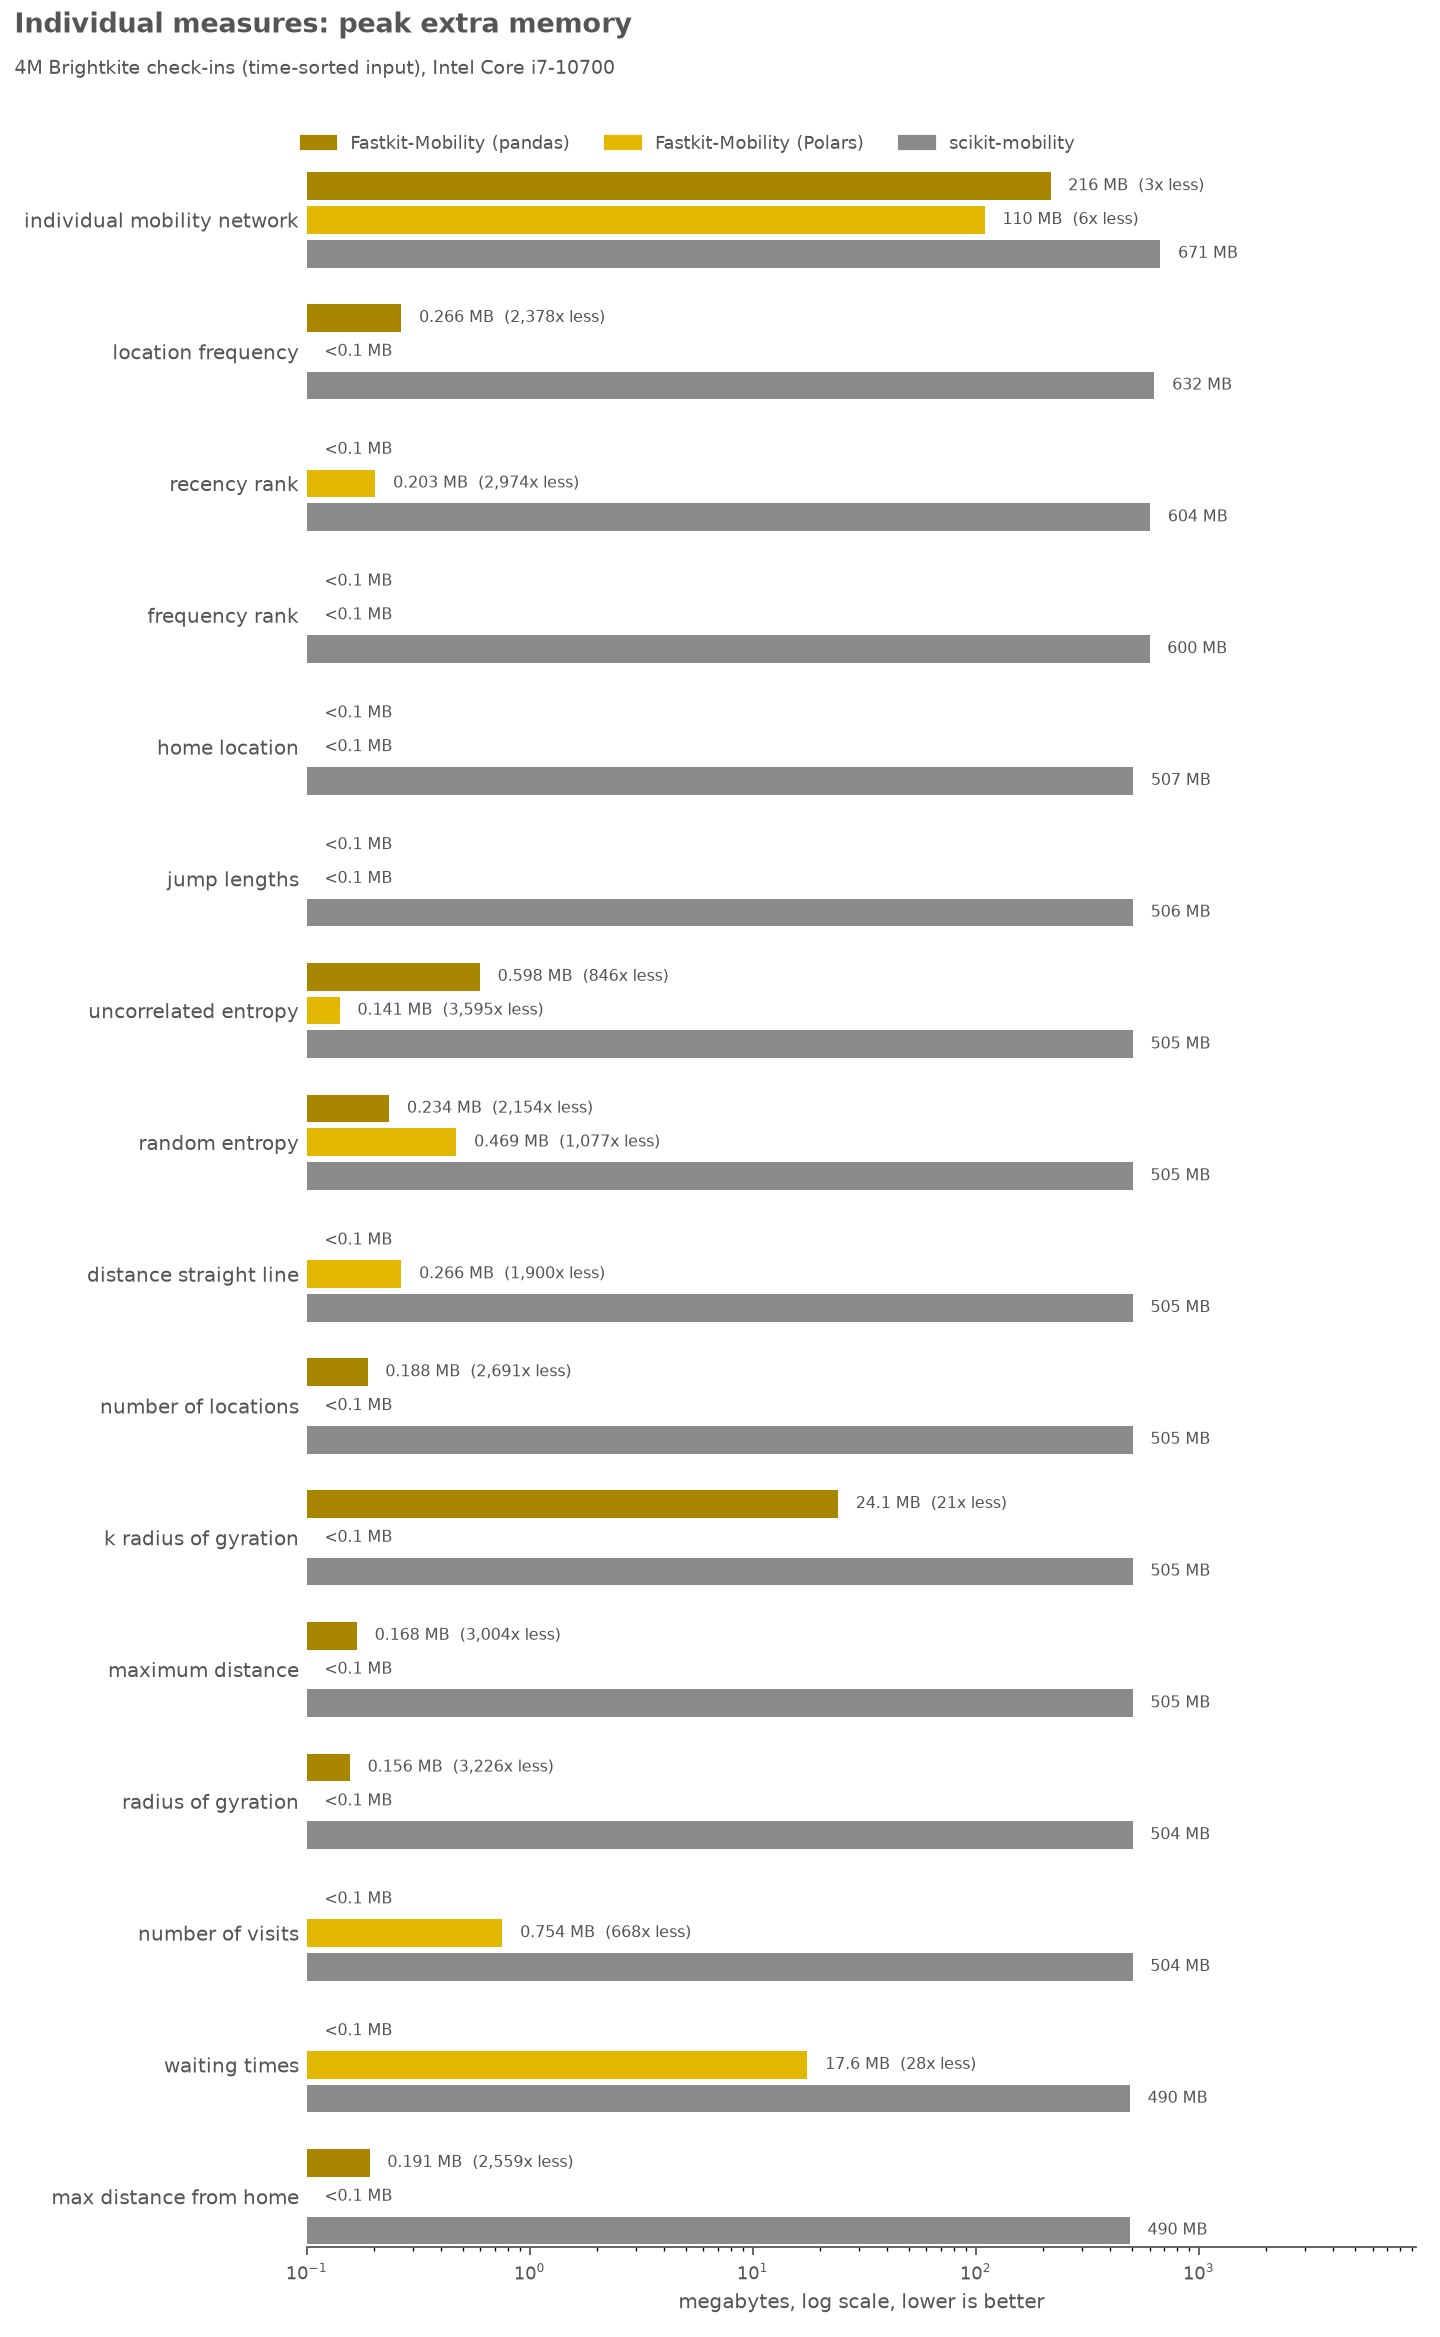
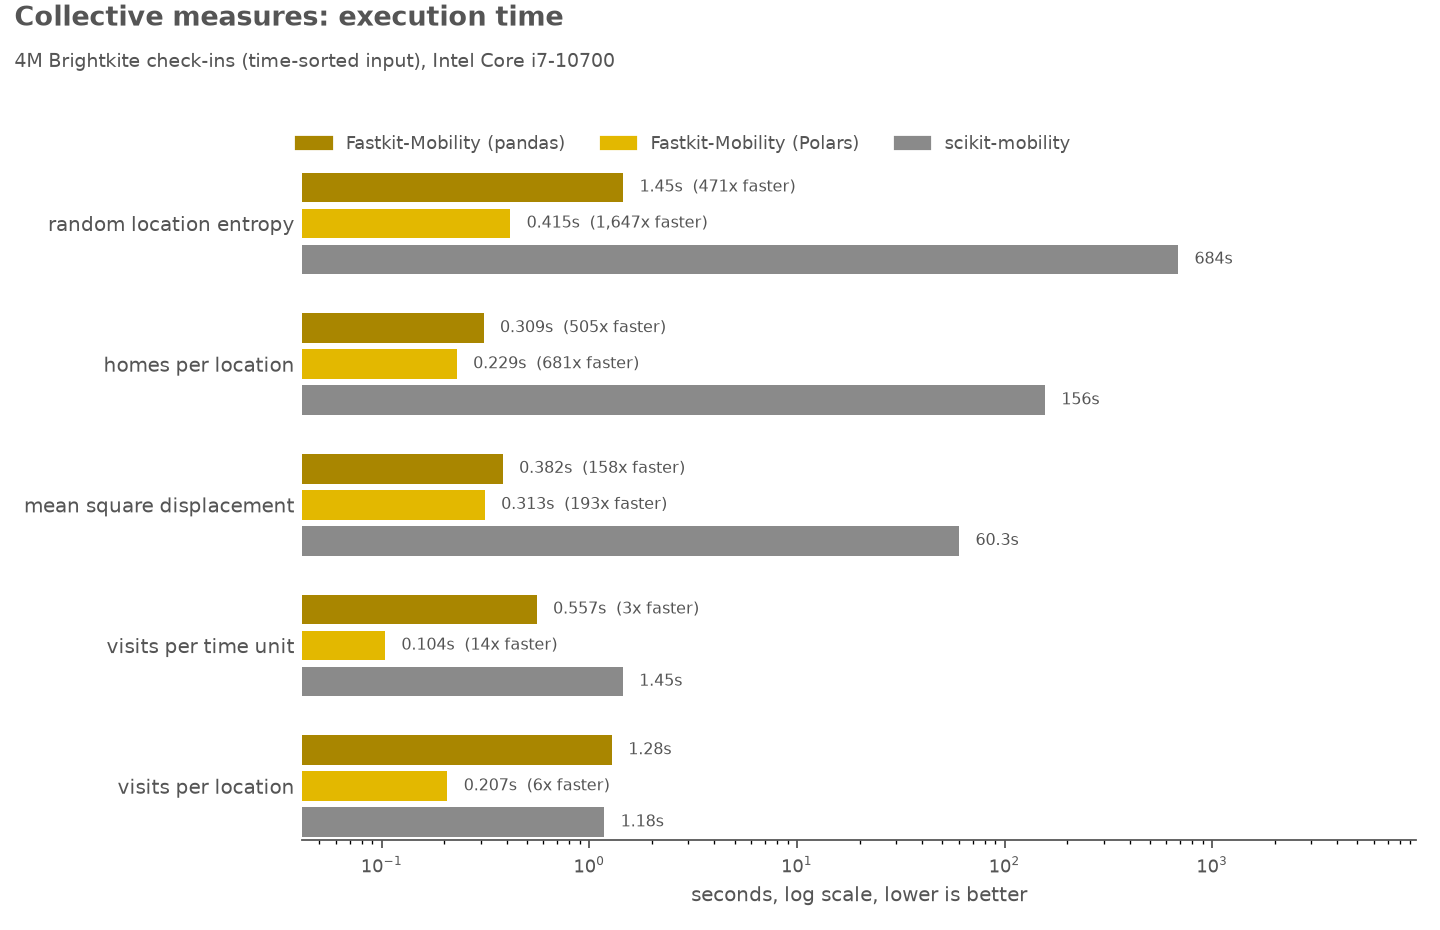
These plots compare Fastkit-Mobility with every library that offers the same function, on the largest datasets we benchmark. Bars show average time (or peak extra memory) on a log axis, and the label on a Fastkit-Mobility bar is its advantage over the best other library. A bar reading timeout or error means the library did not finish.
The numbers are environment-specific, so they should be read as benchmark evidence for this run rather than as a universal performance guarantee.
One function, every library
jump_lengths is the function the most libraries share.
Measures
Individual
Collective
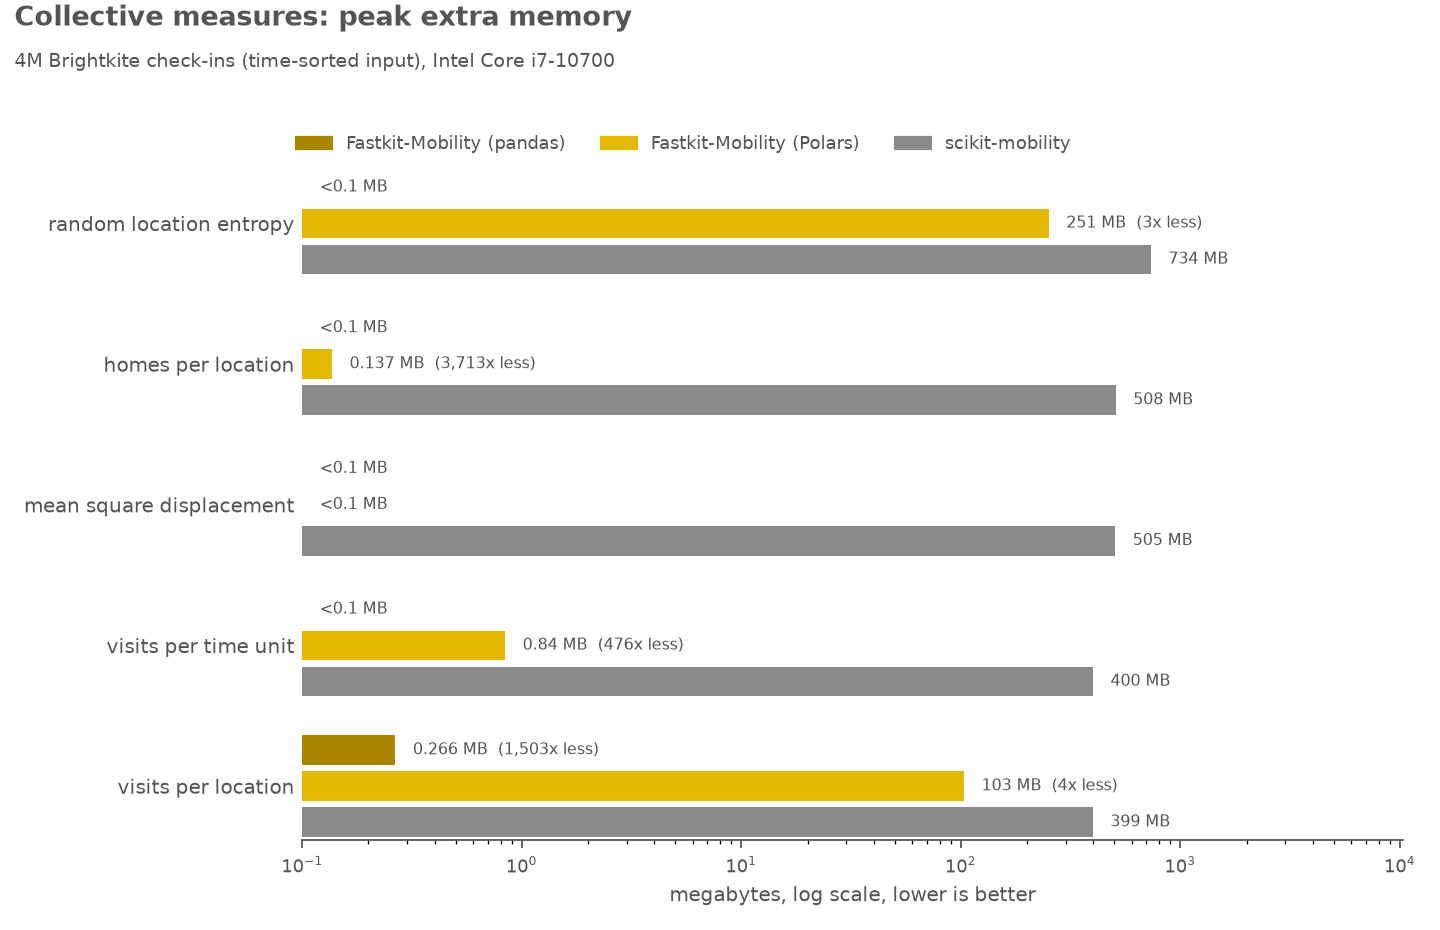
Preprocessing
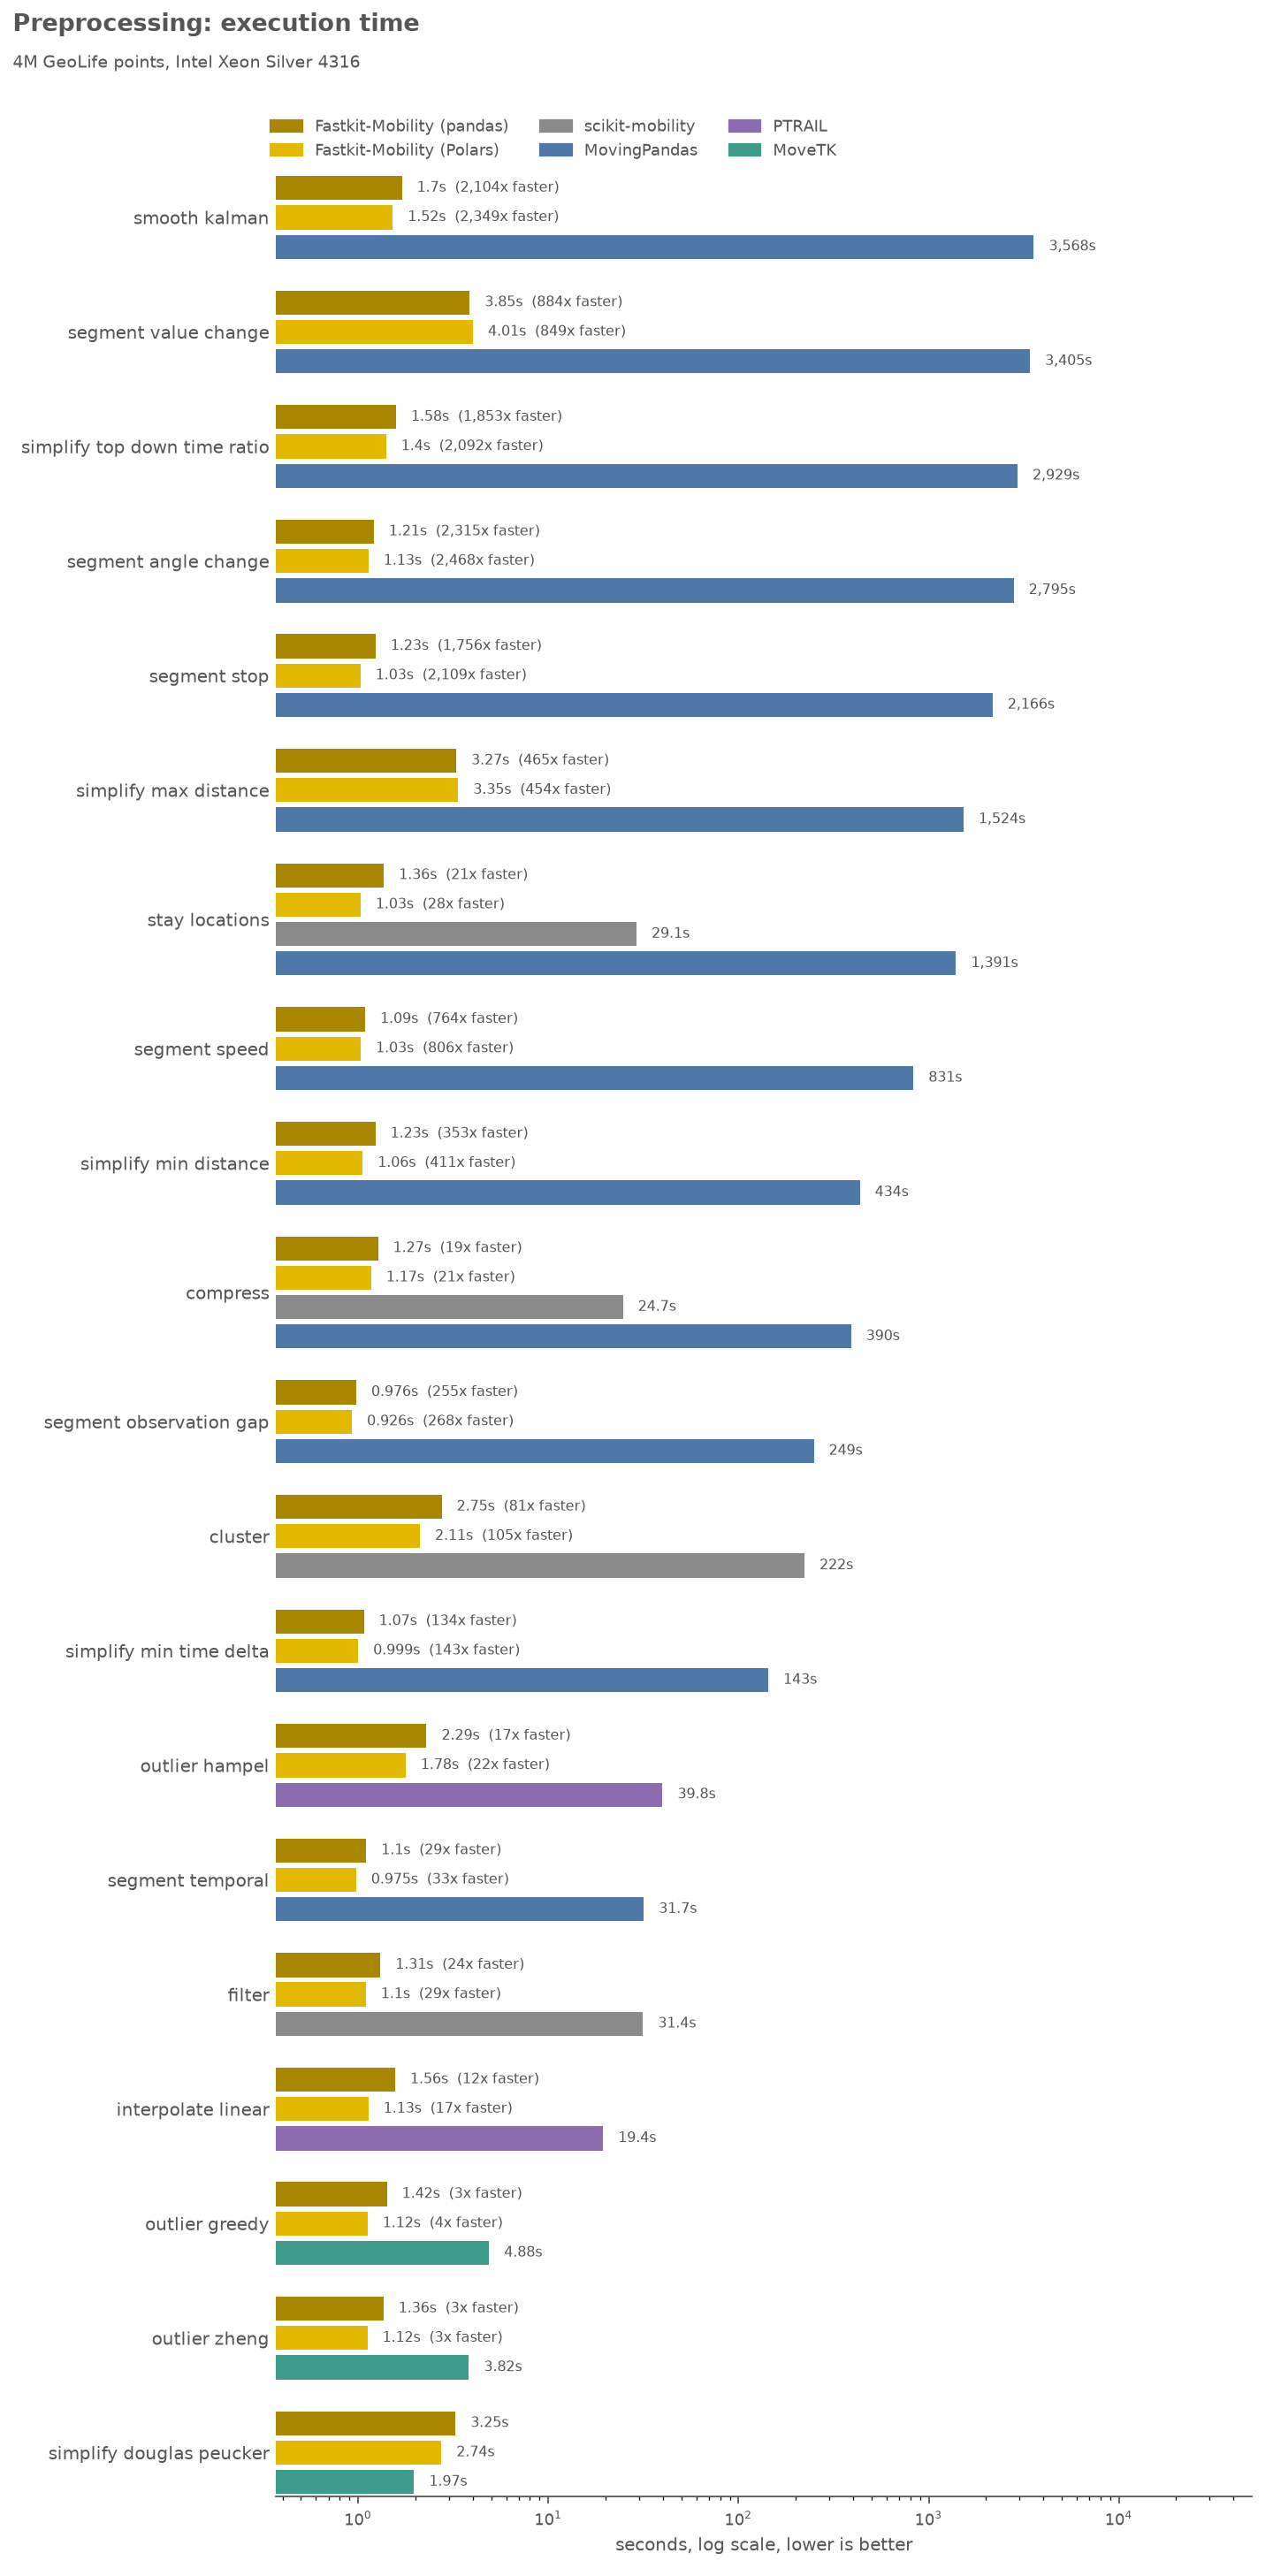
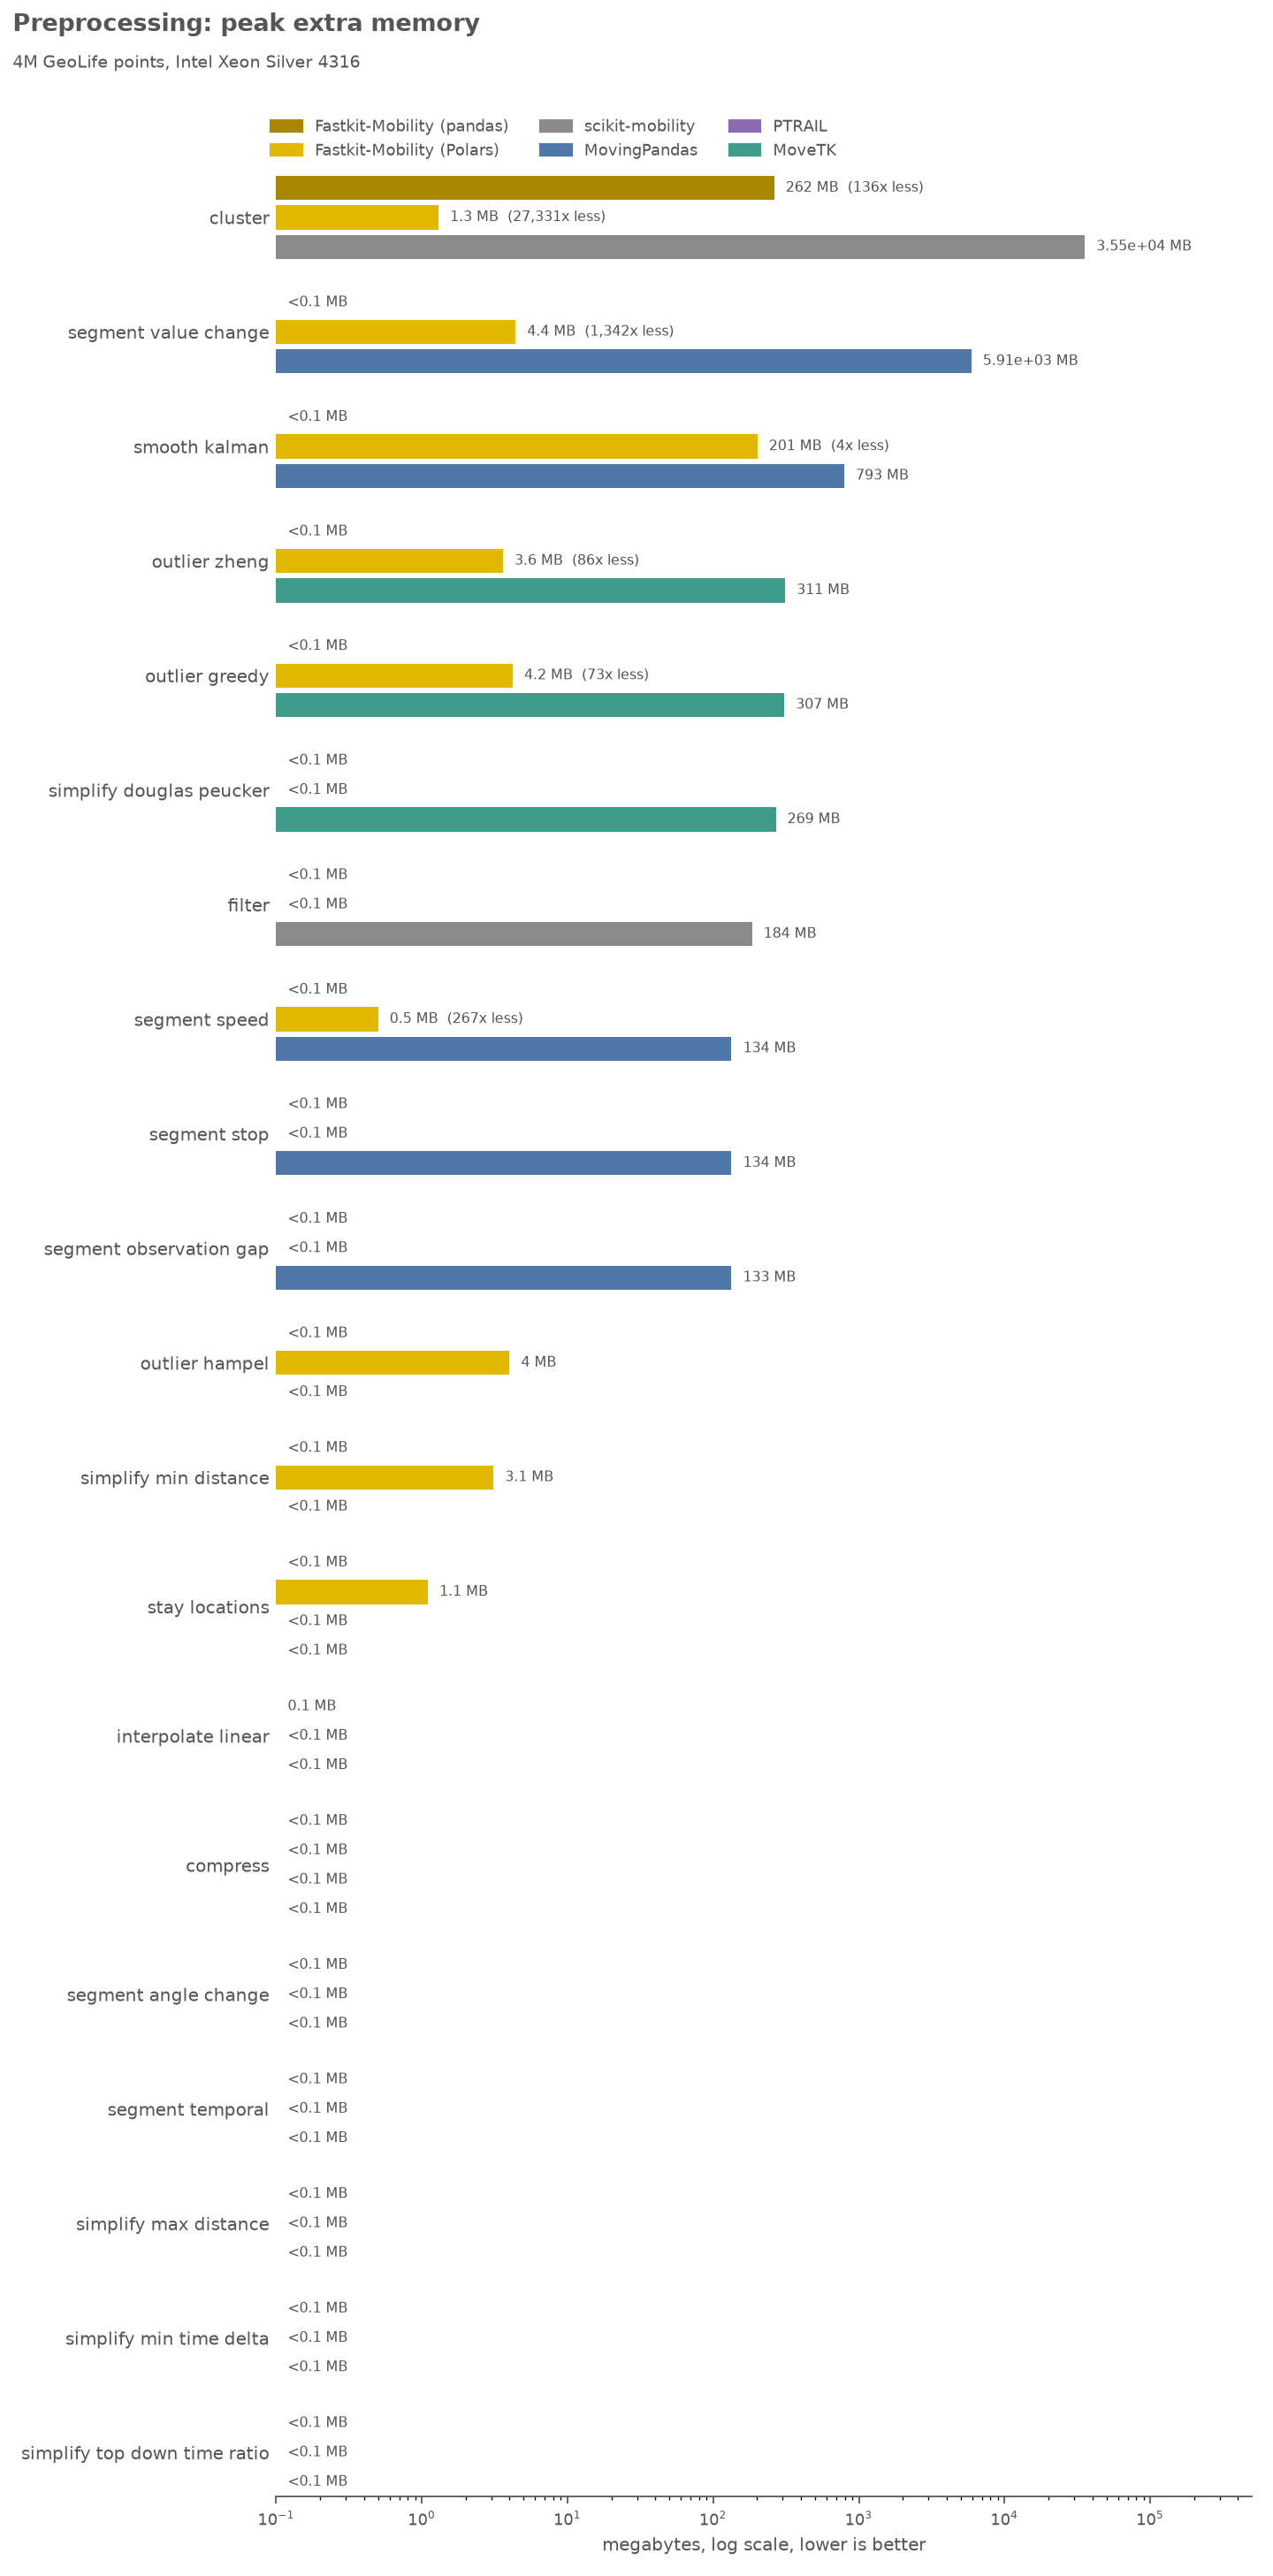
Distributed baseline: SparkMobility
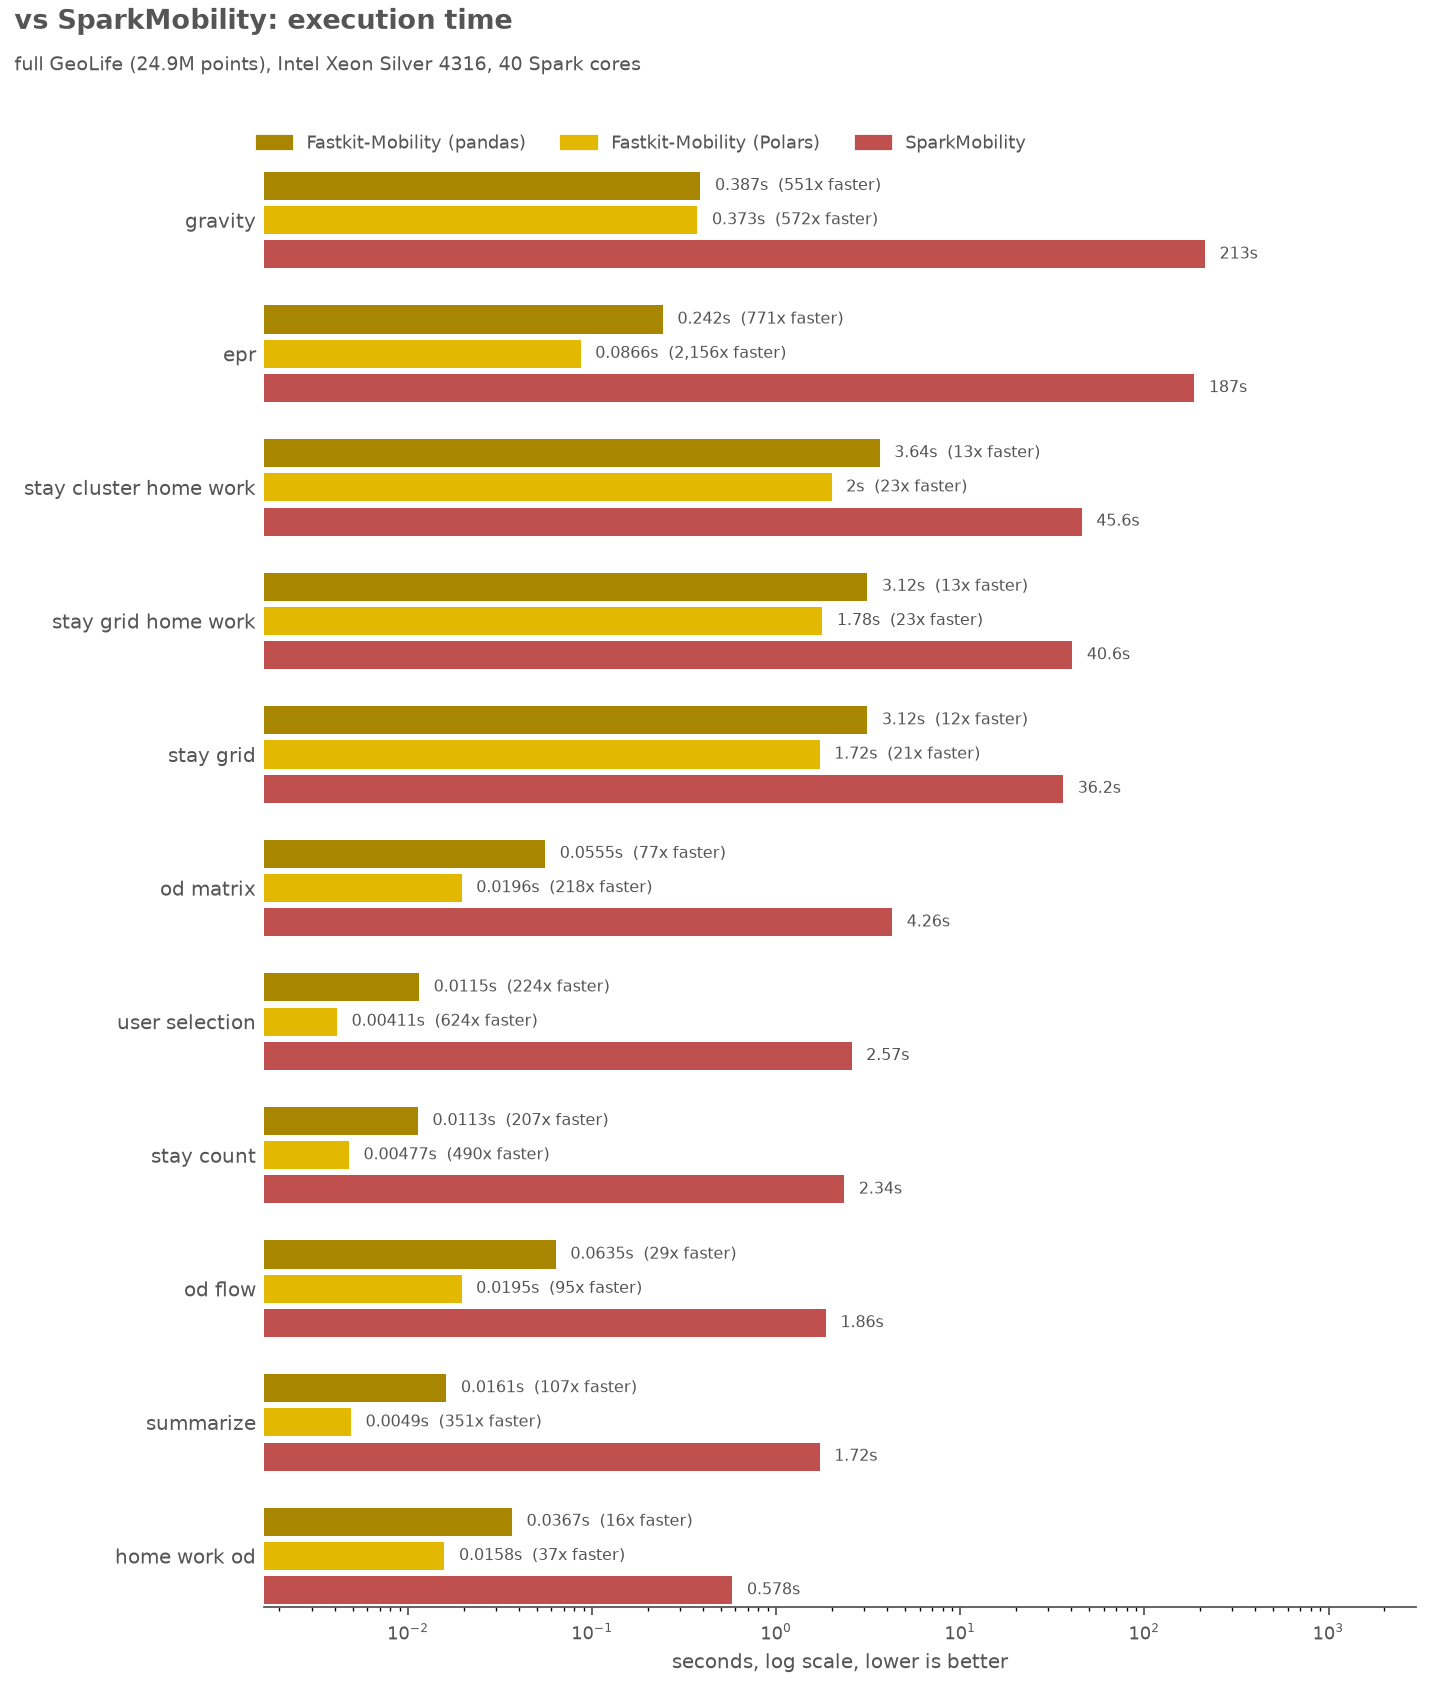
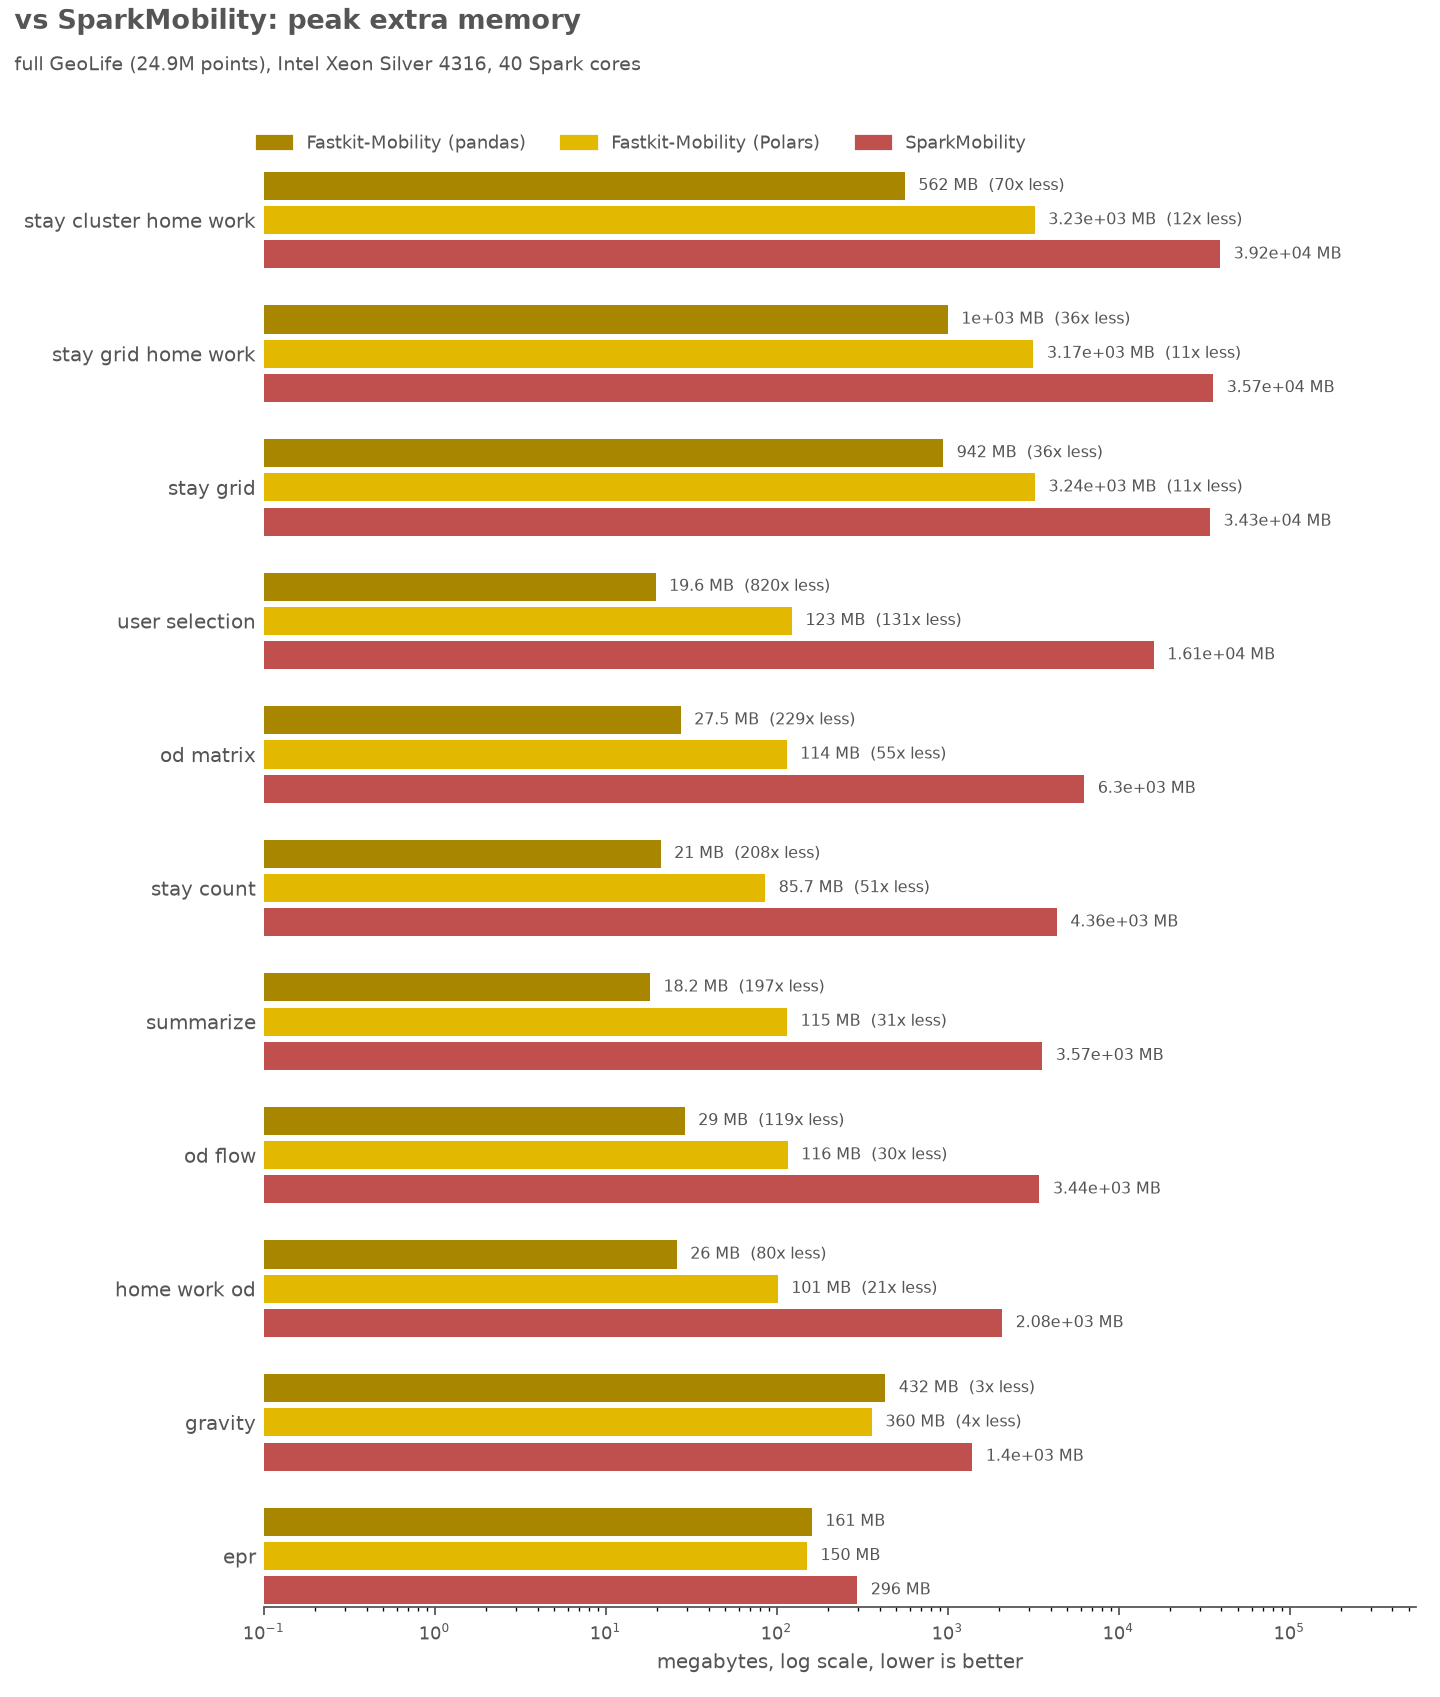
Measures - Evaluation
The evaluation and model plots below are earlier snapshots in the previous plotting style.
Measures - Evaluation - (Speed) - NumPy and Rust kernels

Models
Models Agents - Speed

Models Agents - Speed (No rust core yet...)

Privacy
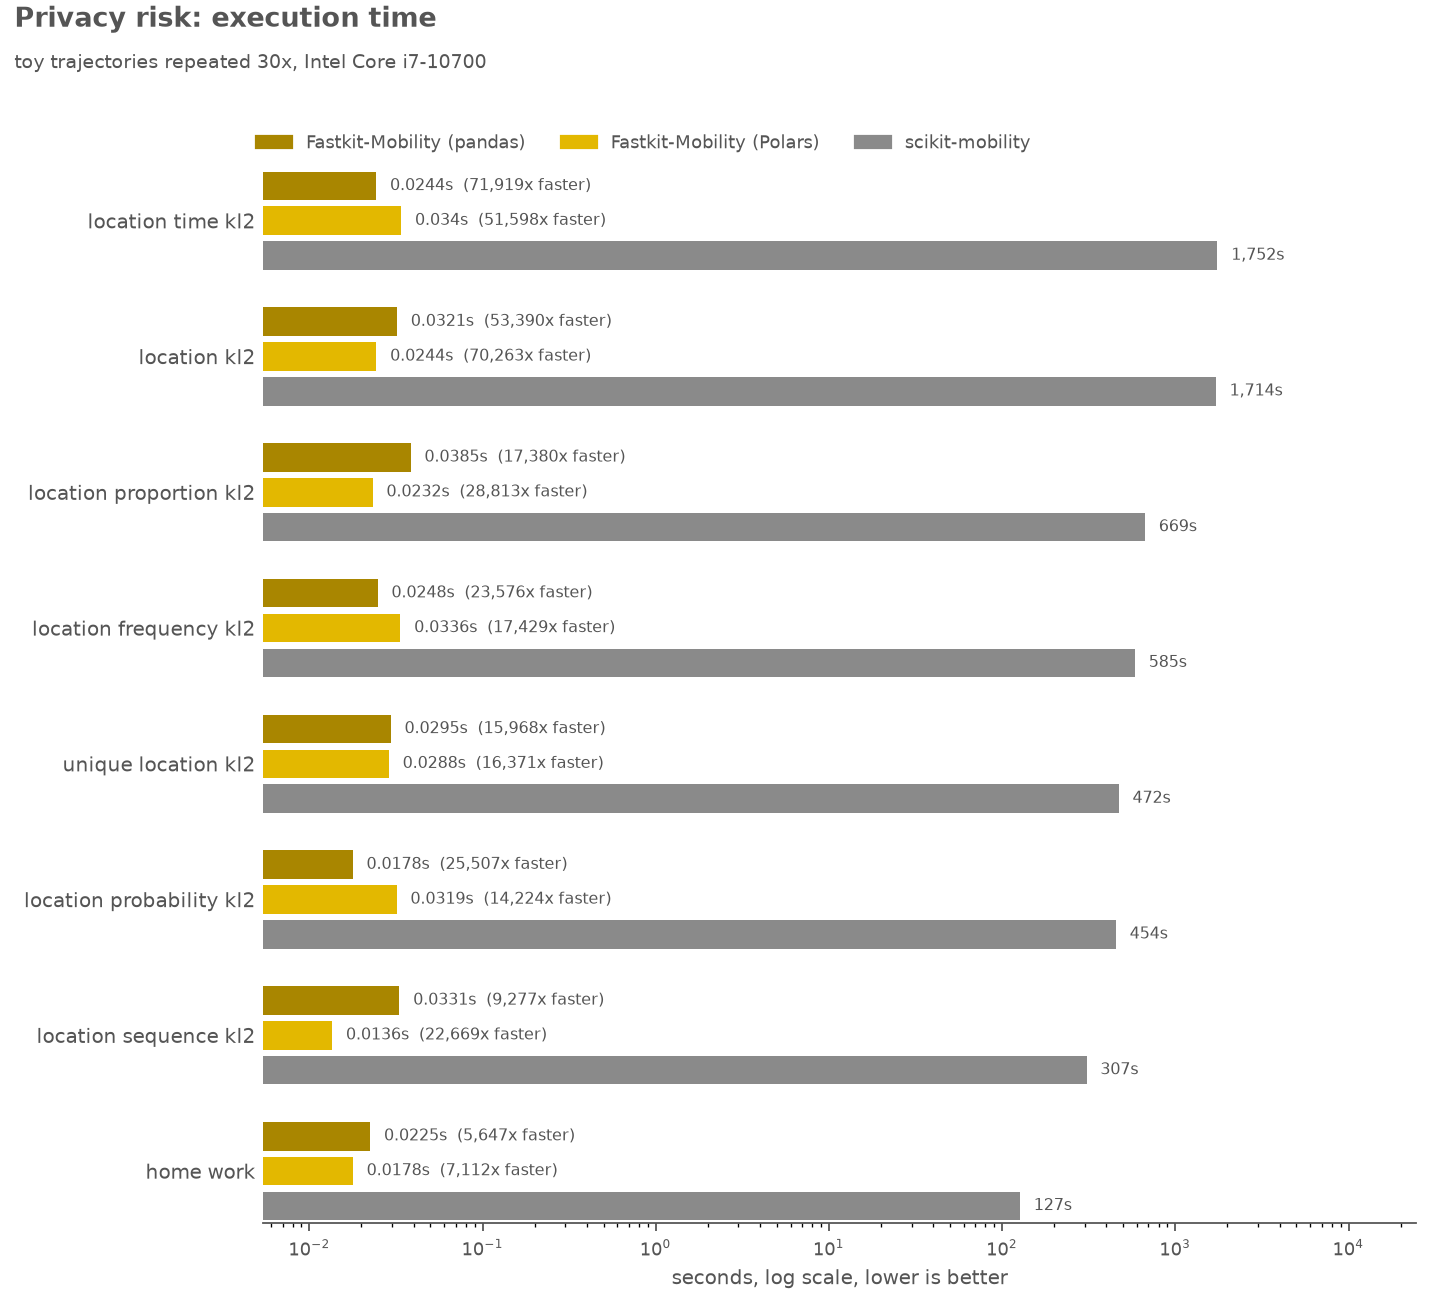
Reproduce the figures
The figures are drawn from the raw results of the sibling fastmob_benchmarks repository:
Each figure is one entry of figures() in that script, so a new comparison needs one new entry.